
Dataland
The world’s first Museum of AI Arts
Description
Kanso designed and built DATALAND’s iOS and Android app: the real-time companion to a museum where nothing is pre-rendered and no two visits are the same. Product design through native development, February–August 2026.
Project type
Year
Location
Services
Design
,
Development
,
Experience
,

The Challenge
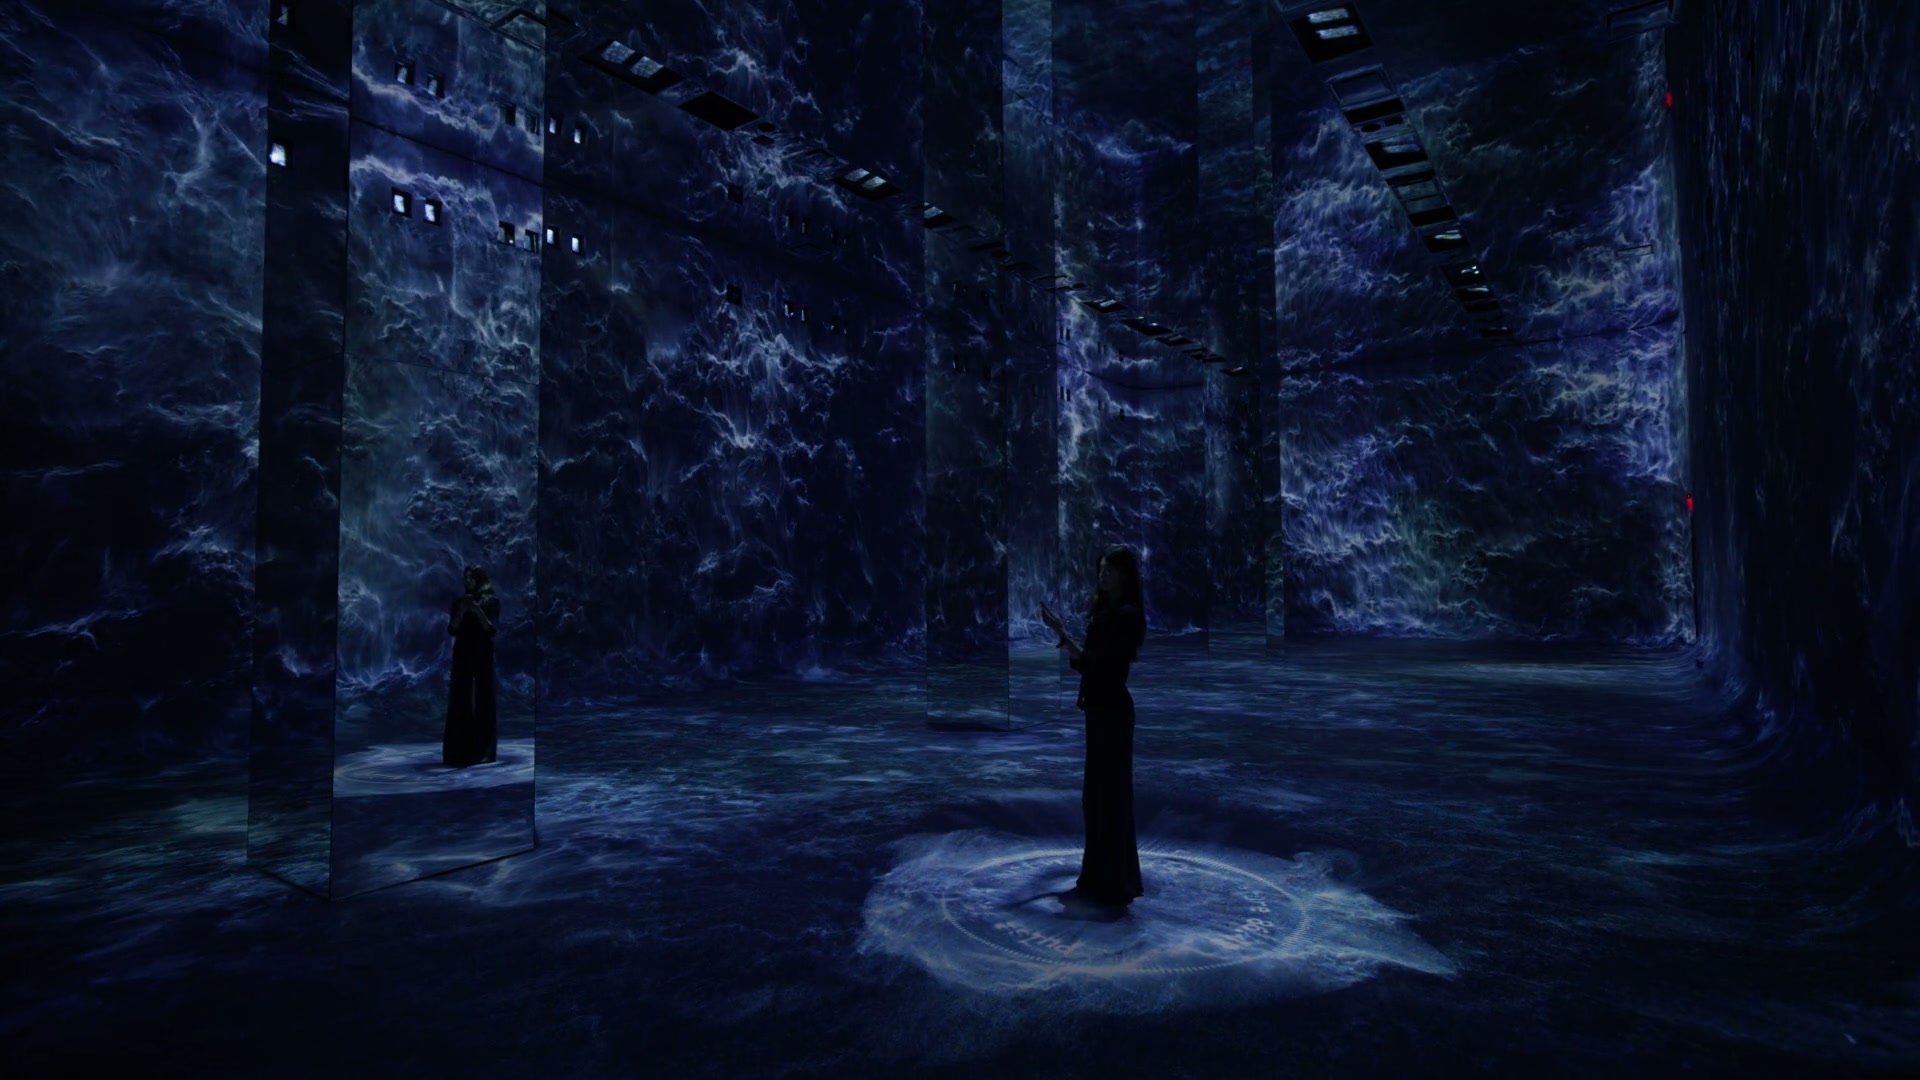
DATALAND doesn’t describe itself as a museum with technology in it. It describes itself as a living museum. Nothing on the walls is pre-rendered, and no two visits are ever the same.
A conventional map-and-catalogue app would have been a static object sitting inside a building that never stays still. The question wasn’t what the app should do. It was why this app should ever be opened at all.

Our Approach
To ensure the app serves as a true companion to the museum rather than overshadowing it, our design strategy prioritized four core principles.
Museum as the focal point. The app is designed to amplify, not replace, the physical environment. Every interaction is carefully calibrated to ensure the museum remains the primary experience.

What We Built
The app doesn't open with a static logo it boots like an instrument via a six-phase sequence that checks and activates each system, signalling that you are stepping inside a machine.
Direct access to information, contextual and dynamic awareness, and a personalized post-visit legacy.
Users interact directly with the museum via the AI guide, getting instant, context-aware answers without complex navigation. At every moment, they know exactly where they are and what they're seeing, as the app surfaces real-time insights generated dynamically in the moment. And the experience doesn't end at the exit — users can save their journey, revisit key moments, and share their story long after they leave.


Design System
A single geometric grid generates the entire icon set. Every mark follows the same stroke weight and angle rules, which keeps the interface legible at small sizes and consistent across both native platforms.
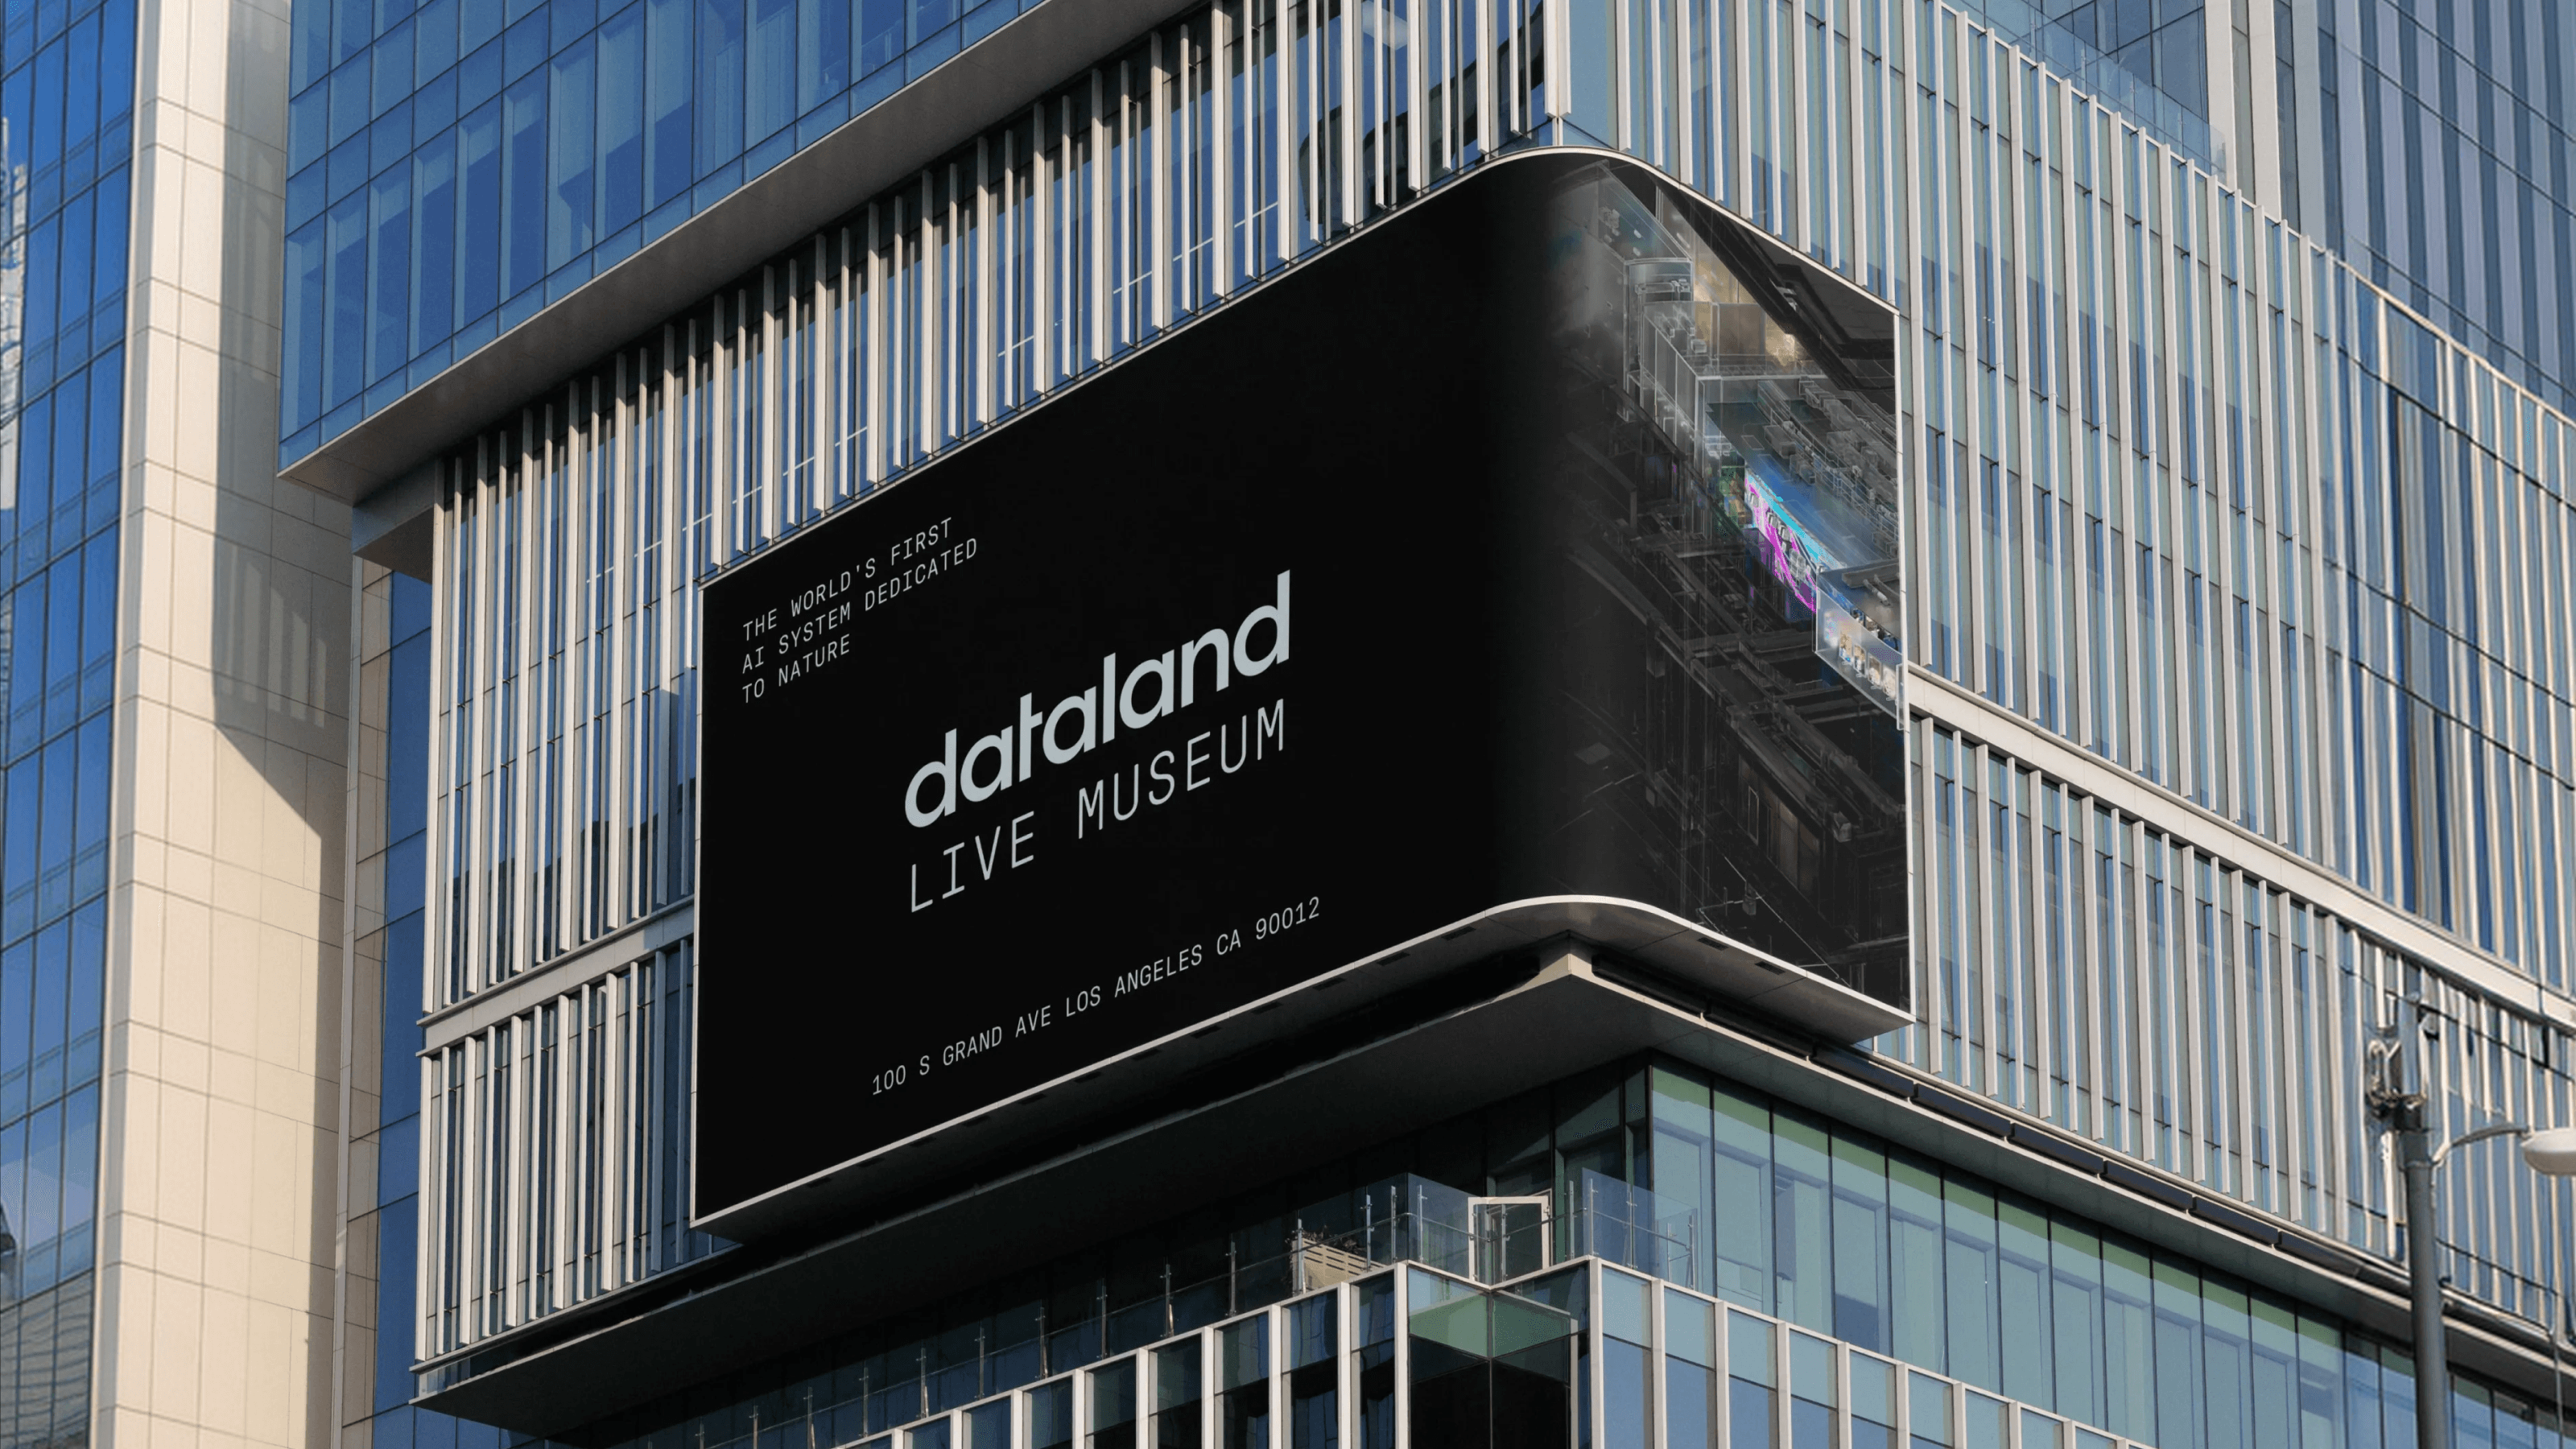
That same system extends beyond the screen. The out-of-home campaign carries the museum's visual language into the city each placement generated by the same system that drives the exhibition, so the outdoor work stays in sync with whatever is running inside.


Ticketing & Explore
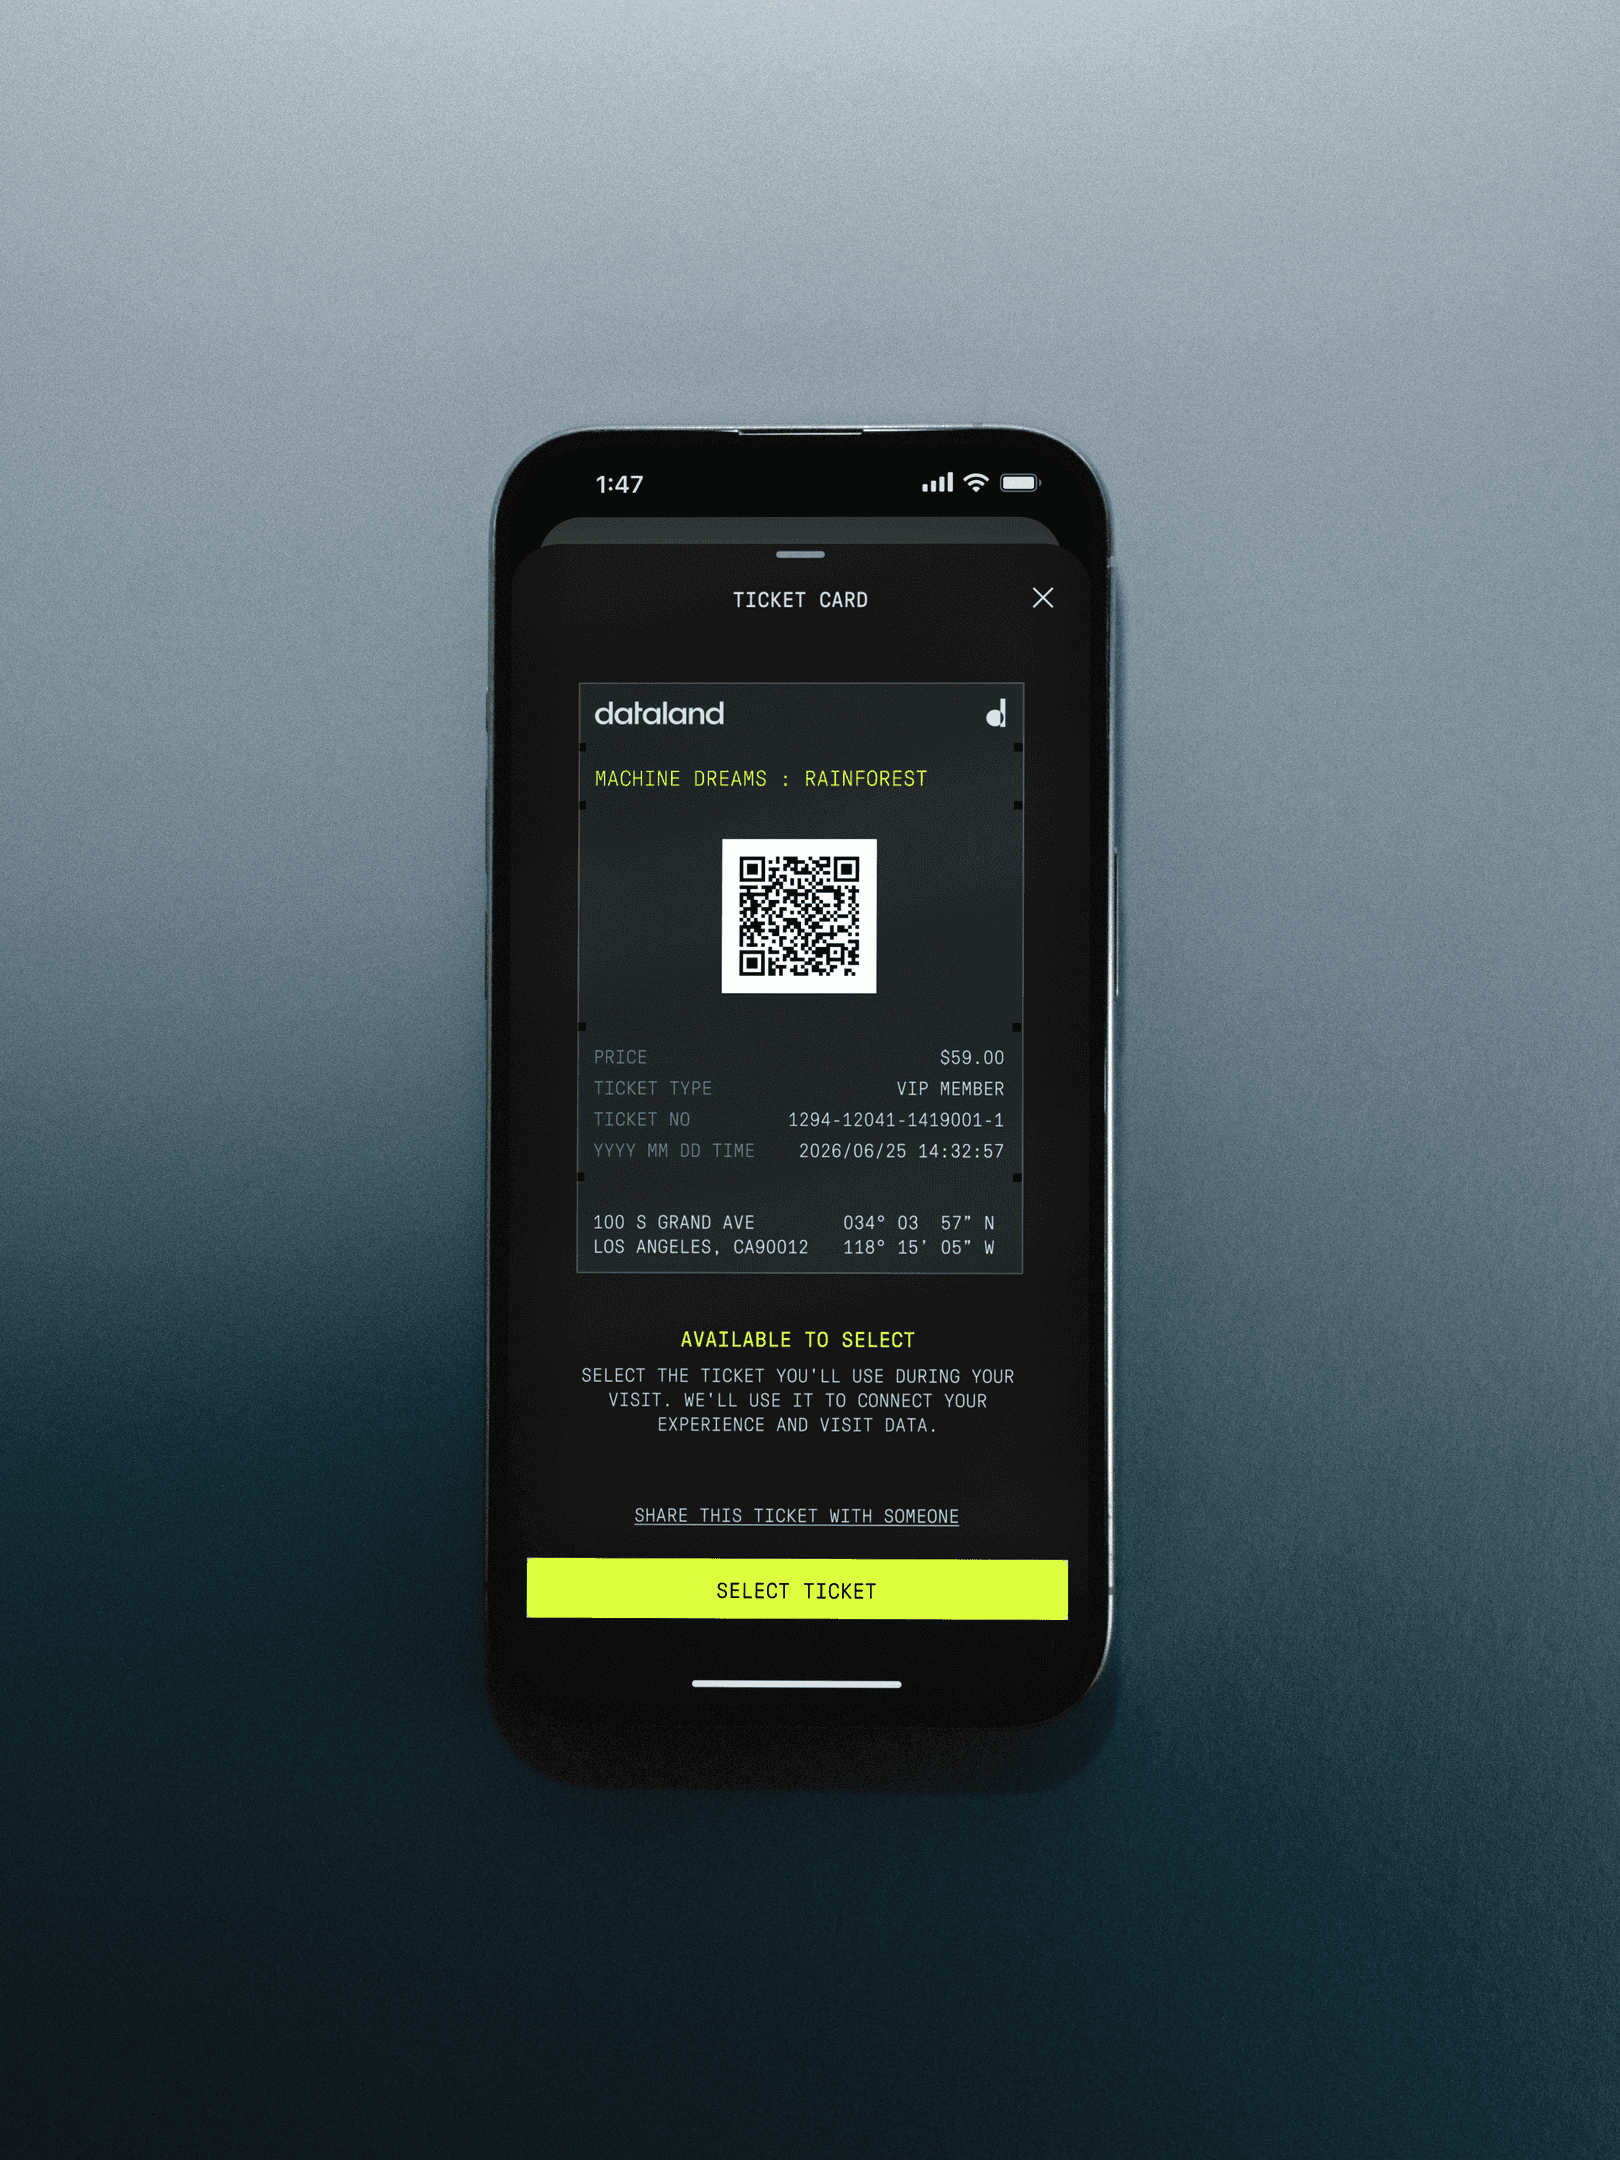
The main navigation centers on three key tabs Home, Explore, and MyDataland providing seamless access to ticket management, upcoming exhibition details, and essential visitor resources.

Live Experience
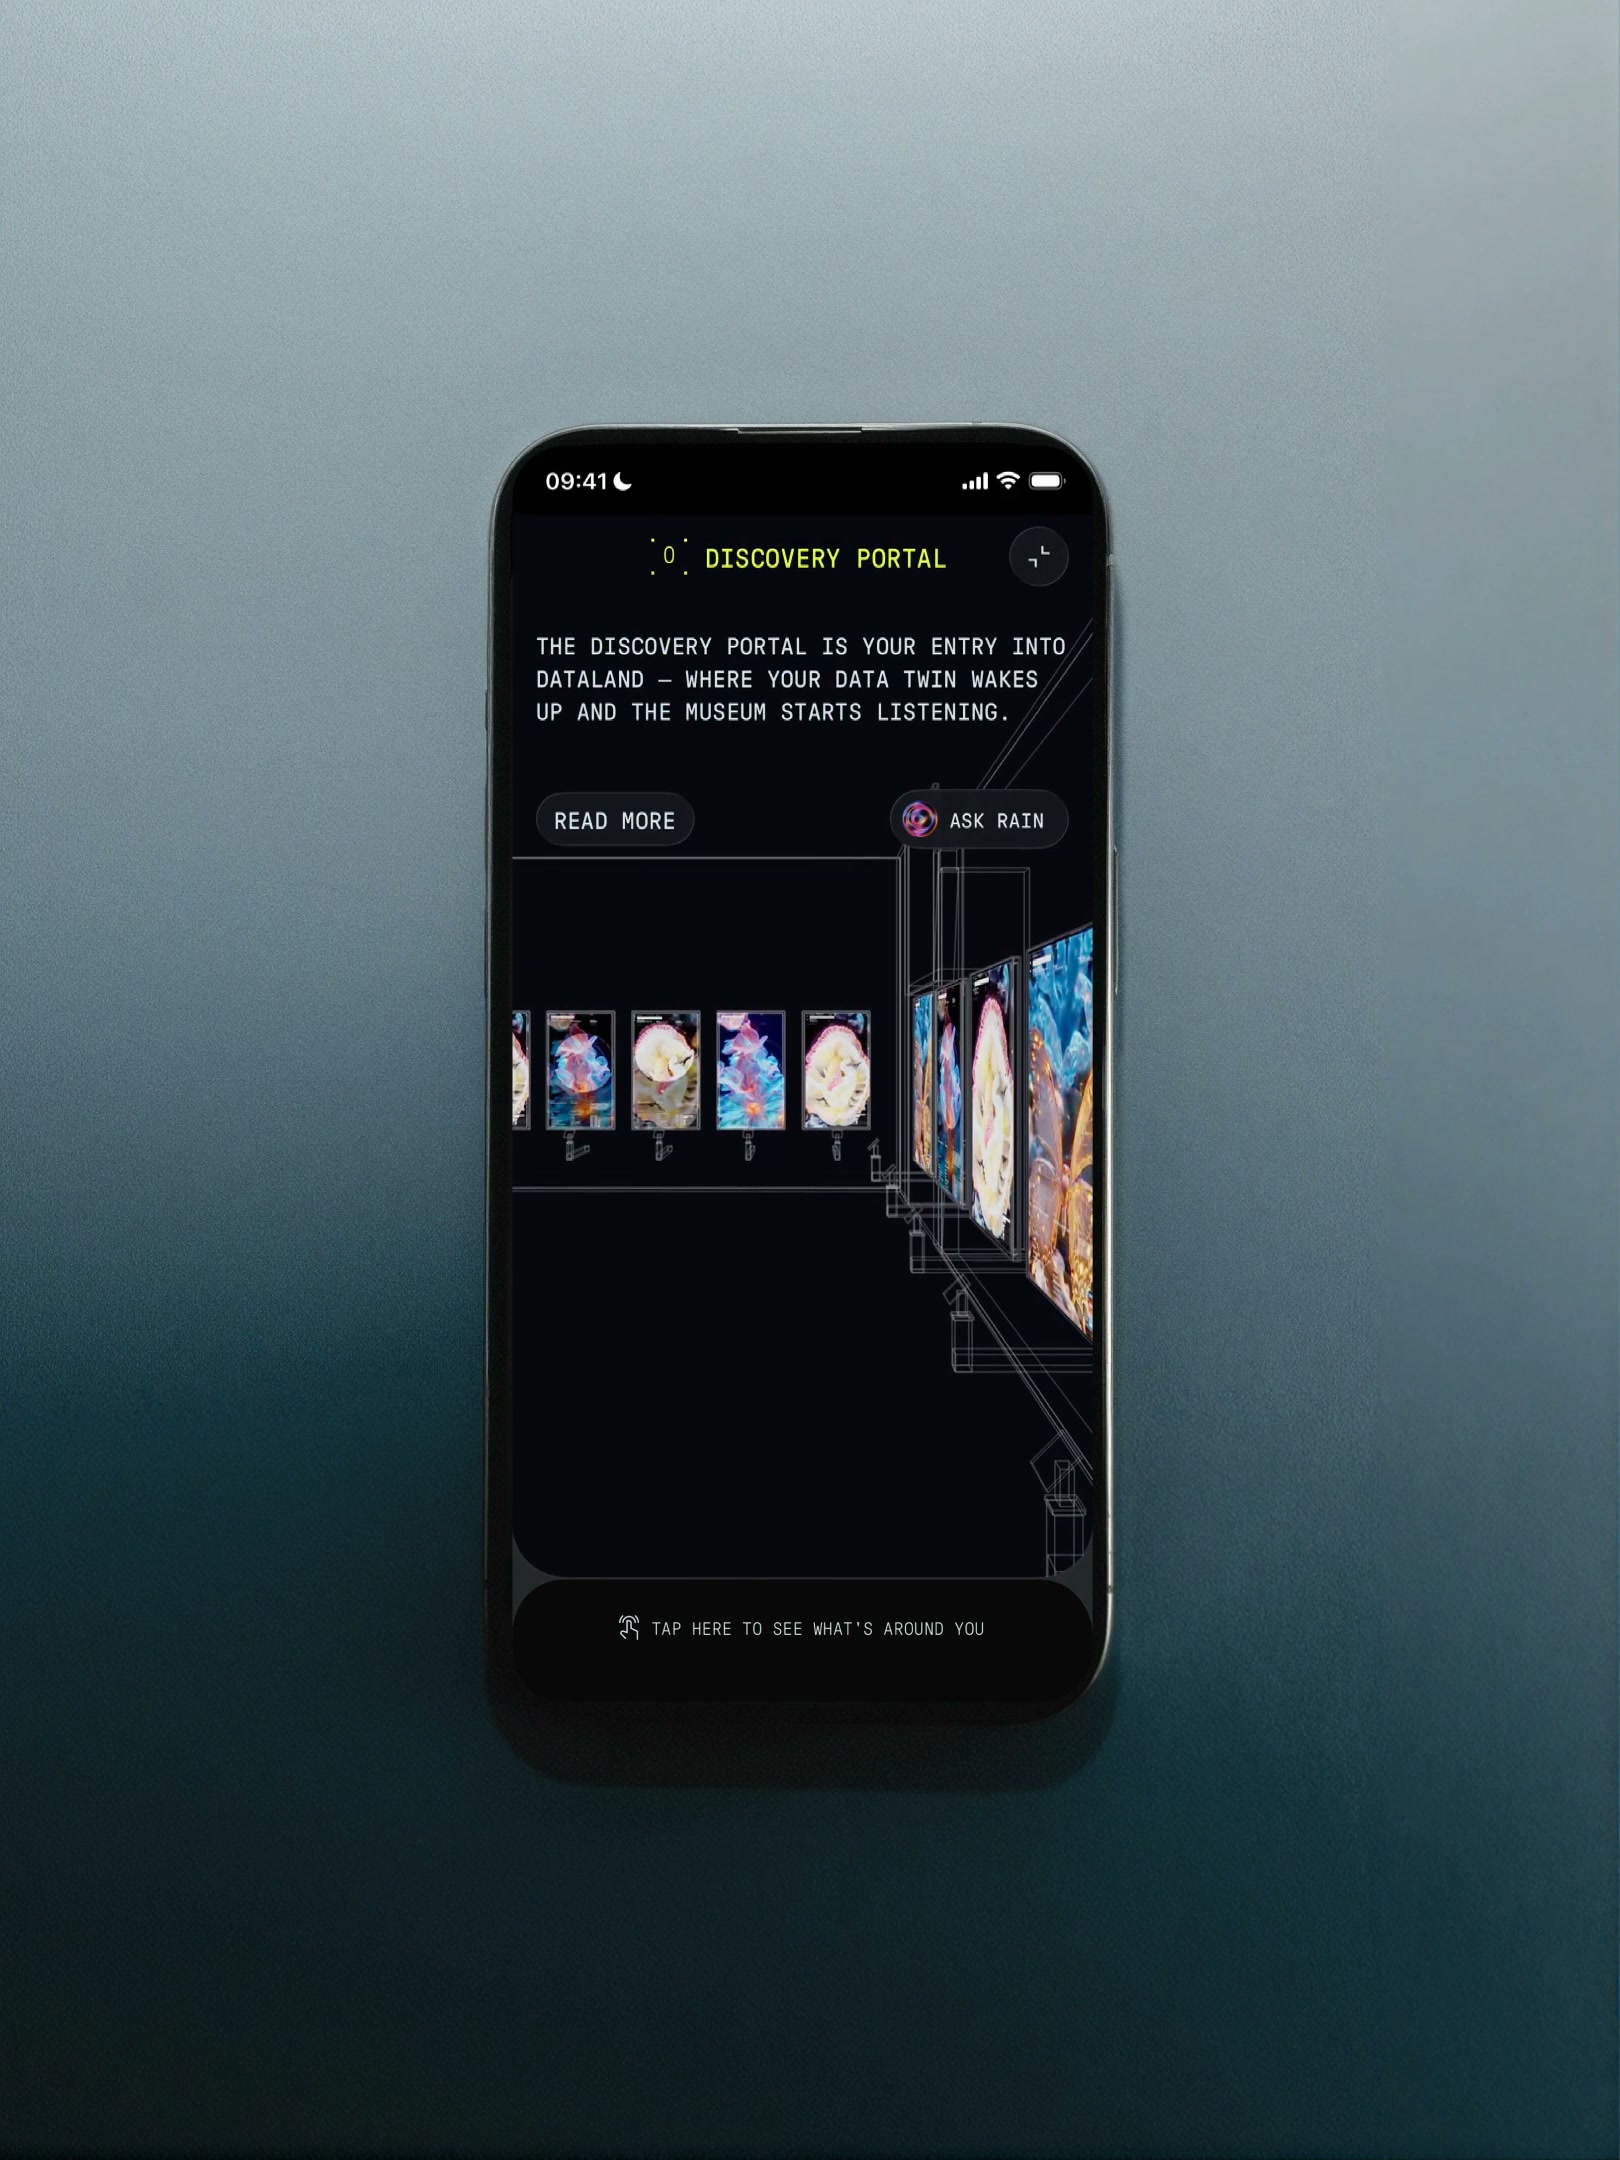
At the core of the in-gallery journey is the Live Experience mode — three dedicated screens, navigated fluidly with a single gesture. Each one answers a different question: where you are, what's happening around you right now, and who can guide you through it. Rather than forcing visitors to choose between exploring the space and understanding it, the interface moves with them, surfacing the right screen at the right moment. The result feels less like using an app and more like an extension of the museum itself.


Map
A 3D map where exhibits are placed, allowing users to view their own location, see the session heatmap, explore gallery details, and inspect museum data. Visitors move between galleries through a live spatial index each space reports its own state (capacity, current chapter, sensory conditions) so the app can guide without interrupting the visit.


Now
A context-aware dashboard that dynamically displays real-time information about the user's immediate surroundings, such as the artwork they are viewing, ambient scents, or sounds. It also enables direct interaction with the galleries.


RAIN
An AI chat interface that actively listens to the museum's data streams. It is aware of the user's location and emotional context, allowing it to guide users, provide detailed information about exhibits, answer questions, and even identify artworks via photos. Even the RAIN orb itself is generated in real time, reacting dynamically to the guest's emotional state.


Everything here runs on a single requirement: the app must deliver the truth in real time not what happened this morning, but what's happening this second, in this room, for this user. The 3D map functions as a living interface, with artwork rendered as a seamless video atlas integrated directly into the scene, powered by a data engine processing over 2,000 events per second museum infrastructure, real-time user metrics, heatmap analytics, and inputs from 16 distinct rainforest data streams, all synchronized so the right content appears at exactly the right moment.

Wrap
When the visit concludes, the Wrap screen provides a meaningful end to the journey. It summarizes your time inside, highlighting which rooms captured your attention and how the space adapted to your presence. Because DATALAND's ephemeral data architecture automatically erases session details after 30 days, this personalized, shareable summary serves as the permanent record of your unique museum experience.


DATALAND doesn't stand still, so the app couldn't either. Every screen had to know where you were, show you something only you could see, and hold onto it after you'd gone or it wasn't really alive at all.
That's the app we built: one that follows the museum's own promise, screen by screen.



"Kanso delivered an interface that perfectly bridges the gap between human imagination and machine intelligence. I highly recommend them to anyone looking for a team that can deeply grasp complex, dynamic environments and execute them with flawless precision"

Refik Anadol
Co-founder, Dataland
